

1. Income Report

The Income Report in SpynPRO gives you a clear overview of your organization’s financial health — showing what you’ve earned, spent, and saved over time.
💰 What You’ll See in the Income Report
1. Income
Total money received from:
- Client payments
- Registrations
- Any other revenue sources
2. Expense
All outgoing costs, such as:
- Staff salaries
- Rent or lease payments
- Equipment and supplies
- Miscellaneous overheads
3. Net Balance
This is your Income minus Expenses. It reflects your profit or savings during the selected period.
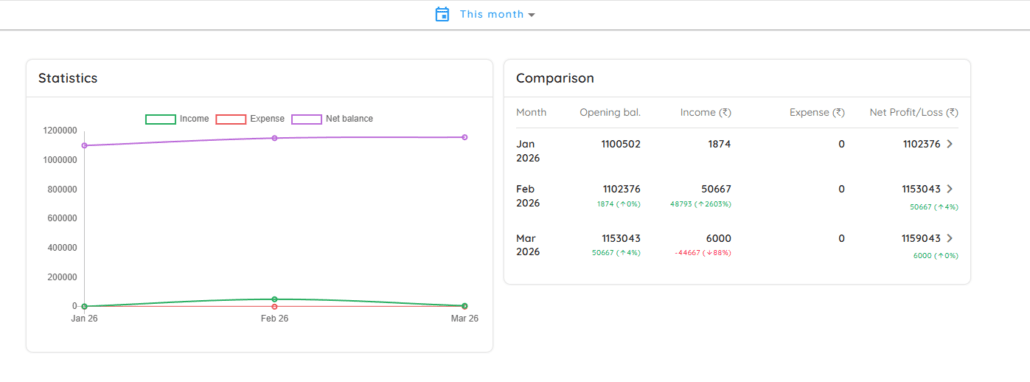
📈 View Comparisons Over Time
The Comparison view helps you spot trends in income and expenses by comparing:
- Monthly, quarterly, or yearly data
- Growth or decline in revenue streams
- Any sudden rise in spending
This is useful for:
- Budget planning
- Evaluating marketing impact
- Making informed business decisions
🔍 Insight: Use this feature to compare high-performing months with slower periods. Look for patterns or unusual spikes.
See More Details: Click the arrow icon (>) next to any month to open the detailed Transaction Report for that specific month.2. The Transaction Report
Once you click the arrow, you will see a “the detailed list.
- Summary Boxes: Quickly see your total Income, Expense, and Net Balance for that period.
- The List:
- Description: Shows who paid (e.g., “ABC”) or what the money was for.
- Category: Shows which part of your business the money belongs to (e.g., “ACADEMY”).
- Mode: Shows how the money was paid (e.g., “online” or “cash”).
- Balance (₹): Shows your running total after each specific payment.
- Filters: Use the All Locations or All Mode buttons at the top to find specific payments quickly.
- Download Reports: Click the Download icon in the top right corner to save these lists as an Excel file on your computer.